


09/04/2024
REPORT ON THE PRODUCTION AND BUSINESS TRENDS OF THE PROCESSING, MANUFACTURING INDUSTRIES IN THE FIRST QUARTER OF 2024 AND FORECAST FOR THE SECOND QUARTER OF 2024
02/04/2024According to assessments from enterprises in the processing, manufacturing, and business activities sector in the first quarter of 2024, it was more challenging than the fourth quarter of 2023, with 64.9% of enterprises evaluating their business activities in the first quarter of 2024 as better and stable compared to the fourth quarter of 2023 (22.1% better and 42.8% stable), while 35.1% of enterprises assessed their business activities as more difficult[1]. The forecast for the second quarter of 2024 is more optimistic than the first quarter of 2024, with 82.0% of enterprises evaluating their business activities in the second quarter of 2024 as better and stable compared to the first quarter of 2024 (45.4% better, 36.6% stable), while 18.0% of enterprises assessed their business activities as more difficult.
1. General Overview of Business Activities
The assessment of business activities can be based on balance indices[2]. General balance indices evaluate the overall trend of business activities of enterprises, while component balance indices (new orders, labor utilization, production volume, and finished goods inventory) evaluate specific business activities of enterprises in the processing and manufacturing industries. Below are the results of the assessment of business activities of selected enterprises in the processing and manufacturing industries using both general and component balance indices.
1.1.General Balance Index
The general balance index evaluates the overall trend of business activities in the first quarter of 2024 compared to the fourth quarter of 2023 at -13.0% (22.1% of enterprises evaluated their business activities as better, 35.1% evaluated them as more difficult). The balance index for the highest FDI enterprise area is -7.8% (24.2% better, 32.0% more difficult); state-owned enterprise area -11.0% (24.9% better, 35.9% more difficult); non-state-owned enterprise area -15.5% (20.9% better, 36.4% more difficult).

The general balance index for the second quarter of 2024 compared to the first quarter of 2024 is 27.4% (45.4% of enterprises forecast better business activities, 18.0% of enterprises forecast more difficult business activities). The highest balance index is in the non-state-owned enterprise area with 28.1% (45.9% better, 17.8% more difficult); FDI enterprise area with 26.7% (44.5% better, 17.8% more difficult); state-owned enterprise area with 21.3% (43.2% better, 21.9% more difficult).
1.2. The balance index of new orders
The balance index of new orders in the first quarter of 2024 compared to the fourth quarter of 2023 is -15.6% (20.9% of enterprises perceive an increase in new orders, 36.5% of enterprises perceive a decrease in new orders). Specifically, the balance index for the FDI enterprise area is -11.7%; state-owned enterprise area is -17.2%; non-state-owned enterprise area is -17.4%.
The balance index of new orders in the second quarter of 2024 compared to the first quarter of 2024 is 25.1% (42.2% of enterprises forecast an increase and 17.1% of enterprises forecast a decrease); the non-state-owned enterprise area has the highest balance index with 26.5%; the FDI enterprise area is 23.7% and the state-owned enterprise area is 17.5%.

1.3. Labor Utilization Balance Index
The labor utilization balance index in the first quarter of 2024 compared to the fourth quarter of 2023 is -11.1% (9.9% of enterprises perceive an increase in labor utilization, 21.0% of enterprises perceive a decrease). Specifically, the balance index for the non-state-owned enterprise area is highest at -10.9% (7.7% increase, 18.6% decrease); the FDI enterprise area is -11.0% (15.2% increase, 26.2% decrease); the state-owned enterprise area is -13.0% (7.3% increase, 20.3% decrease).
The labor utilization balance index in the second quarter of 2024 compared to the first quarter of 2024 is 6.9% (18.4% increase and 11.5% decrease); the FDI enterprise area has the highest balance index with 13.1%; the non-state-owned enterprise area is 4.5% and the state-owned enterprise area is 1.0%.
1.4. Production Volume Balance Index
The production volume balance index in the first quarter of 2024 compared to the fourth quarter of 2023 is -16.5% (22.3% of enterprises perceive an increase in production volume; 38.8% of enterprises perceive a decrease). Specifically, the balance index for the FDI enterprise area is highest at -12.1% (24.3% perceive an increase, 36.4% perceive a decrease); the state-owned enterprise area is -15.6% (23.6% perceive an increase, 39.2% perceive a decrease); the lowest is the non-state-owned enterprise area at -18.6% (21.3% increase, 39.9% decrease).
The production volume balance index in the second quarter of 2024 compared to the first quarter of 2024 is 26.4% (44.1% of enterprises forecast an increase, 17.7% of enterprises forecast a decrease); the non-state-owned enterprise area has the highest balance index at 27.2%; the FDI enterprise area is 25.7% and the state-owned enterprise area is 19.9%.

1.5.Finished Goods Inventory Balance Index
The finished goods inventory balance index in the first quarter of 2024 compared to the fourth quarter of 2023 is -8.6% (19.3% of enterprises perceive an increase and 27.9% of enterprises perceive a decrease). Specifically, the balance index in the FDI enterprise area is -6.7% (21.2% increase, 27.9% decrease); non-state-owned enterprise area -8.9% (18.6% increase, 27.5% decrease); state-owned enterprise area -15.7% (16.9% increase, 32.6% decrease).
The finished goods inventory balance index in the second quarter of 2024 compared to the first quarter of 2024 is -11.4% (17.2% increase, 28.6% decrease); FDI enterprise area -4.0%; non-state-owned enterprise area -14.2%; and state-owned enterprise area -19.6%.
In summary, the manufacturing and business activities of processing and manufacturing industries decreased in the first quarter of 2024 compared to the fourth quarter of 2023 due to the Tet Lunar New Year holiday. The forecast for the second quarter of 2024 is more optimistic than the first quarter of 2024, with the overall balance index, new order balance index, labor utilization balance index, and production volume balance index all increasing by 27.4%, 25.1%, 6.9%, and 26.4% respectively.
2. Fluctuations of Input Factors
2.1. Number of New Orders
According to the survey results in the first quarter of 2024, 63.5% of enterprises perceive an increase or no change in the number of new orders compared to the fourth quarter of 2023 (20.9% increase, 42.6% remain unchanged); 36.5% of enterprises perceive a decrease in the number of new orders.

By economic sector, other processing and manufacturing industries have the highest proportion of enterprises perceiving an increase in new orders in the first quarter of 2024 compared to the fourth quarter of 2023, at 28.6%. Conversely, the non-metallic mineral products manufacturing sector has the highest proportion of enterprises perceiving a decrease in new orders, at 48.3%.
The forecast for the number of new orders in the second quarter of 2024 compared to the first quarter of 2024 is optimistic, with 82.9% of enterprises forecasting an increase or maintaining the same level (42.2% increase, 40.7% maintain), while 17.1% of enterprises forecast a decrease.
Export Orders
Among the surveyed enterprises, 66.4% perceive an increase or no change in the number of new export orders in the first quarter of 2024 compared to the fourth quarter of 2023 (19.1% increase, 47.3% maintain), while 33.6% perceive a decrease.
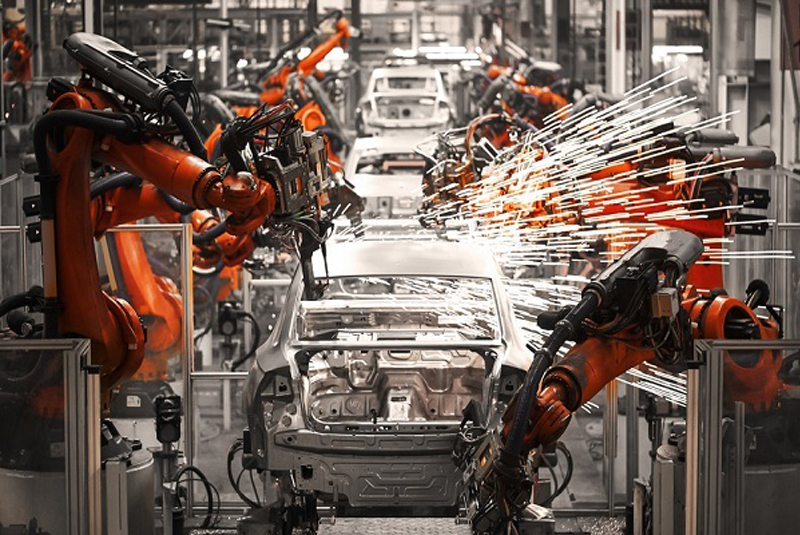
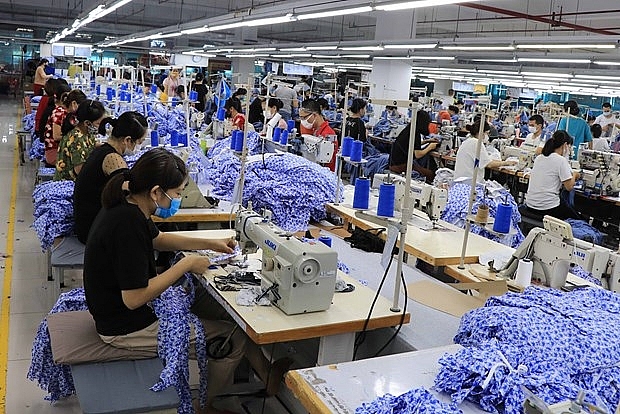
By economic sector, the motor vehicle manufacturing industry has the highest proportion of enterprises perceiving an increase in new export orders in the first quarter of 2024 compared to the fourth quarter of 2023, at 33.3%. Conversely, the textile industry has the highest proportion of enterprises perceiving a decrease in new export orders, at 42.0%.
Enterprises forecast a more optimistic outlook for the number of new export orders in the second quarter of 2024, with 82.9% forecasting an increase or maintaining the same level compared to the first quarter of 2024 (36.9% increase, 46.0% maintain), while 17.1% forecast a decrease.

2.2.Labor Utilization
In the first quarter of 2024, 9.9% of enterprises perceived an increase in labor utilization compared to the fourth quarter of 2023; 69.1% perceived no change, and 21.0% perceived a decrease.
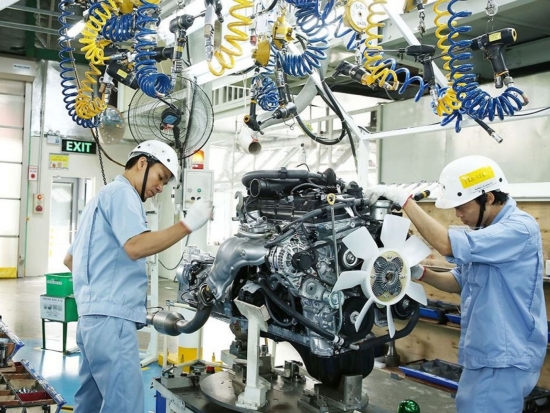
By economic sector, the electronic, computer, and optical product manufacturing sector had the highest proportion of enterprises perceiving an increase in labor utilization in the first quarter of 2024 compared to the fourth quarter of 2023, at 25.2%. Conversely, the garment manufacturing sector had the highest proportion of enterprises perceiving a decrease in labor utilization in the first quarter of 2024 compared to the fourth quarter of 2023, at 29.8%.
The forecast for labor utilization in the second quarter of 2024 is more optimistic than the first quarter of 2024, with 88.5% of enterprises expecting the number of workers to increase or remain the same (18.4% increase, 70.1% maintain), while 11.5% of enterprises anticipate a decrease.

2.3.Production Costs
Survey results indicate that in the first quarter of 2024, 92.6% of enterprises perceived an increase or no change in the production costs per unit of product (27.7% increase, 64.9% no change), while 7.4% of enterprises perceived a decrease compared to the fourth quarter of 2023.

By economic sector, the metal manufacturing industry had the highest proportion of enterprises perceiving an increase in production costs per unit of product in the first quarter of 2024 compared to the fourth quarter of 2023, at 33.6%. Conversely, the electronic, computer, and optical product manufacturing sector had the highest proportion of enterprises perceiving a decrease in production costs per unit of product in the first quarter of 2024 compared to the fourth quarter of 2023, at 12.9%.
For the forecast of the second quarter of 2024 compared to the first quarter of 2024, 90.8% of enterprises anticipate an increase or no change in production costs per unit of product (22.8% increase, 68.0% no change), while 9.2% of enterprises anticipate a decrease.
2.4.Capacity utilization of machinery and equipment
In the first quarter of 2024, the average capacity utilization of machinery and equipment in the manufacturing industry was 71.6%[7]. 39.5% of enterprises assessed the capacity utilization of machinery and equipment to be between 70% and below 90%; 26.8% assessed it to be between 90% and 100%; 20.6% assessed it to be between 50% and below 70%, and 13.1% assessed it to be below 50%.
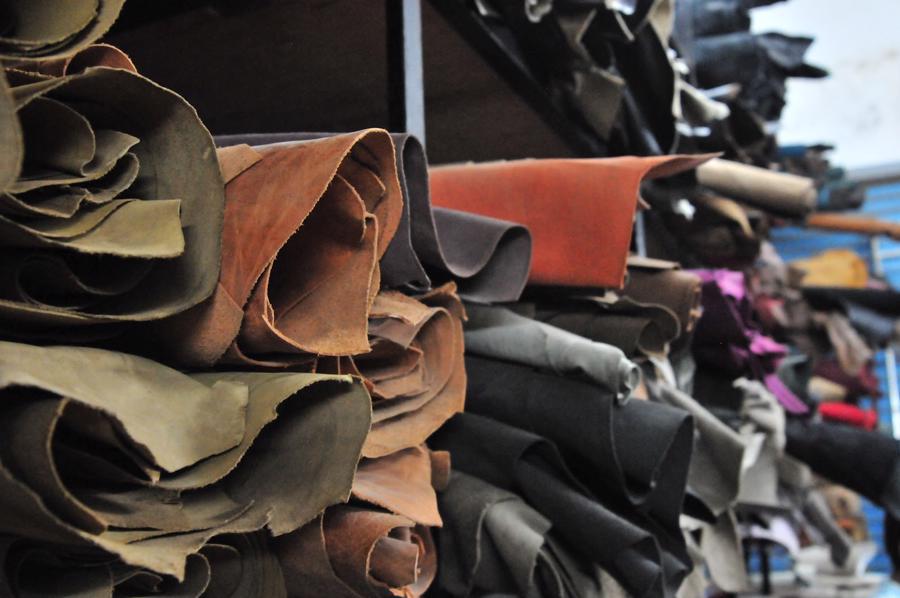
By economic sector, in the first quarter of 2014, the leather and related product manufacturing industry had the highest average capacity utilization of machinery and equipment at 79.9%. The “other transport equipment manufacturing” sector and the machinery and equipment repair, maintenance, and installation sector had the lowest proportion of enterprises assessing the average capacity utilization of machinery and equipment, at 64.8%.

3. Projected Output Results
3.1.Production Volume
According to the survey results for the first quarter of 2024, 61.2% of enterprises assessed that the production volume increased or remained unchanged compared to the fourth quarter of 2023 (22.3% increased, 38.9% remained unchanged), while 38.8% of enterprises assessed a decrease in production volume.

According to the economic sectors, the “Other processing and manufacturing industries” sector had the highest proportion of enterprises reporting an increase in production volume for the first quarter of 2024 compared to the fourth quarter of 2023, at 29.1%. Conversely, the “Other non-metallic mineral products manufacturing” sector had the highest proportion of enterprises reporting a decrease in production volume, at 52.4%.
The production volume for the second quarter of 2024 is expected to be more optimistic, with 82.3% of enterprises forecasting an increase or maintaining the same level (44.1% increase, 38.2% maintain), while 17.7% of enterprises anticipate a decrease.
3.2.Average selling price per unit
The proportion of enterprises reporting an increase or maintenance in the average selling price per unit for the first quarter of 2024 compared to the fourth quarter of 2023 is 89.3% (14.9% increase, 74.4% maintain), while 10.7% of enterprises reported a decrease.
According to economic sectors, the “Metal manufacturing” sector had the highest proportion of enterprises reporting an increase in the average selling price per unit for the first quarter of 2024 compared to the fourth quarter of 2023, at 25.2%. Conversely, the “Other non-metallic mineral products manufacturing” sector had the highest proportion of enterprises reporting a decrease, at 15.7%.
Regarding the average selling price per unit for the second quarter of 2024 compared to the first quarter of 2024, 91.6% of enterprises forecast an increase or maintenance (17.4% increase, 74.2% maintain), while 8.4% of enterprises anticipate a decrease.

4.Inventory Fluctuations
4.1. Finished Goods Inventory
According to survey results, 19.3% of enterprises reported an increase in the volume of finished goods inventory for the first quarter of 2024 compared to the fourth quarter of 2023; 52.8% of enterprises assessed that it remained the same, and 27.9% evaluated a decrease.
By economic sector, the automotive manufacturing sector had the highest proportion of enterprises reporting an increase in finished goods inventory for the first quarter of 2024 compared to the fourth quarter of 2023, at 28.7%. Conversely, the sector manufacturing beds, cabinets, tables, and chairs had the highest proportion of enterprises reporting a decrease in finished goods inventory for the first quarter of 2024 compared to the fourth quarter of 2023, at 34.1%.
Forecasting for the second quarter of 2024 compared to the first quarter of 2024, 17.2% of enterprises anticipate an increase in the volume of finished goods inventory; 54.2% expect it to remain the same, and 28.6% forecast a decrease.

4.2. Raw Material Inventory
Survey results indicate that 73.2% of enterprises perceived an increase or maintenance in raw material inventory for the first quarter of 2024 compared to the fourth quarter of 2023 (17.8% reported an increase, while 55.4% reported no change), while 26.8% of enterprises perceived a decrease.
Forecasting for the second quarter of 2024 compared to the first quarter of 2024, 16.8% of enterprises anticipate an increase in the volume of raw material inventory, 55.8% anticipate it to remain the same, and 27.4% of enterprises expect a decrease.

Source:Tongcucthongke
Share this post
Must Read

2023 PARTICIPANT LIST
18/05/2023

[Seminar] INDUSTRIAL METROLOGY
15/05/2023

MTA Vietnam 2022 Webinar
25/04/2022

ADB is optimistic about Vietnam’s economy
13/04/2022

MTA Vietnam 2021 x Bystronic Webinar
08/06/2021

CONFERENCE SERIES
24/05/2021

ONLINE BUSINESS MATCHING PROGRAMMES
21/05/2021
Tags:
You may be interested in


02/04/2024
REPORT ON THE PRODUCTION AND BUSINESS TRENDS OF THE PROCESSING, MANUFACTURING INDUSTRIES IN THE FIRST QUARTER OF 2024 AND FORECAST FOR THE SECOND QUARTER OF 2024

02/04/2024
Industrial production in the first two months of the year increased by 5.7% compared to the same period

28/03/2024
Việt Nam có thể trở thành ‘con rồng AI’

28/03/2024
Vietnam is ready to welcome the wave of investment in smart manufacturing chains.

27/03/2024
Humanoid robot converses with OpenAI language AI

30/01/2024
Boeing supplier greenlighted to build $20M plant in Vietnam
23/01/2024
Vietnam is a potential market for companies engaged in the manufacturing of agricultural machinery and equipment

23/01/2024
‘The Giant’ Goertek is expected to invest over 6,800 billion VND in Vietnam to expand production. Which locality will be chosen?

23/01/2024

